
Bitcoin’s Sharpe Signal is sitting at 0.40, just below the 0.5 threshold that has historically preceded stronger upside phases.
CoinMarketCap has identified several key signals shaping the current position of Bitcoin (BTC), and they are far from aligned.
Whales are quietly accumulating, retail investors are selling, and short-term holders are in the red, while not a single one of the four conditions that could confirm a bull market has been met.
What the Data Shows
One of the most closely watched indicators right now is the Bitcoin Sharpe Signal, which measures risk-adjusted return momentum. According to CoinMarketCap, it is hovering near 0.40 after briefly touching the 0.50 threshold over a week ago when BTC was approaching the $75,000 mark. The platform’s analysts say that, historically, a move above 0.50 has marked stronger upside phases, but for now, the indicator remains in what they are calling a “pre-signal” zone.
Meanwhile, the MVRV Z-Score, which compares Bitcoin’s market value to its realized value, currently reads 0.56, which is a recovery from a low of 0.30 recorded in February. But it is still far below its January level of 1.42, when BTC was worth about $96,000.
The current reading is between 0.4 and 0.8, which is the fair value range. This means Bitcoin is neither cheap nor overheated.
CMC Researchers also noted that short-term holders, those who have owned the asset for less than 155 days, are selling at a loss. Their loss-to-profit ratio has been running at around 8 to 10 times since January, with the worst reading so far being 10.5, which was recorded on February 4.
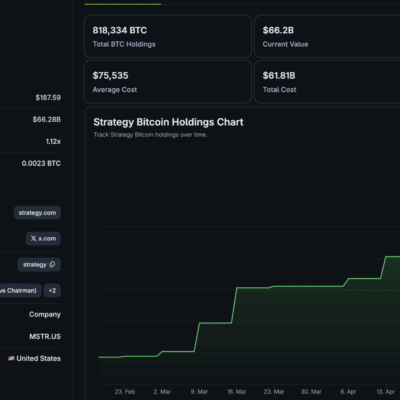
The clearest positive signal comes from exchange flows, with wallets holding over $1 million in Bitcoin withdrawing more than 6,000 BTC from exchanges during the week of March 24, and smaller holders depositing at the same time. This scenario, according to the analysts, suggests there is selling pressure coming from retail participants, and the divergence often appears during early recovery phases, when larger players accumulate while sentiment remains weak.
You may also like:
Despite these developments, the broader “confluence model,” which tracks price, activity, profitability, and supply conditions, is showing zero active bullish signals, as none of the four tracked categories currently meet the criteria for a confirmed market recovery.
Bitcoin Price Action
CMC’s assessment matches up with cautious analysis from market watchers such as Jelle, who yesterday said BTC could revisit the $60,000 range, even possibly dropping further to $50,000 if support levels fail. Another trader, Doctor Profit, also warned that the OG cryptocurrency has not reached its bottom and could fall all the way to $40,000 before any sustained recovery.
On the other hand, Merlijn The Trader noted on March 24 that Bitcoin’s weekly RSI has reached oversold territory for only the fourth time in its history. The previous three instances, in 2019, 2020, and 2022, were followed by gains of 2,700%, 1,800%, and 350%, respectively. They set $65,000 as the level that would need to hold to keep that historical pattern intact.
Bitcoin was trading at just under $70,000 at the time of writing, down nearly 2% in the last 24 hours but gaining 11% over a 30-day period.
Binance Free $600 (CryptoPotato Exclusive): Use this link to register a new account and receive $600 exclusive welcome offer on Binance (full details).
LIMITED OFFER for CryptoPotato readers at Bybit: Use this link to register and open a $500 FREE position on any coin!