April 2026 will be remembered not for explosive gains but for structural repair. After a brutal February and March, marked by sharp drawdowns, leverage flushes, and sentiment washouts that left Bitcoin grinding below $70,000, the market staged a methodical recovery that closed the month near $76,300, representing an approximate 11–12% gain.
Summary
- Bitcoin price recovered more than 11% in April as institutional inflows and spot demand returned across major exchanges.
- ETF inflows, corporate Bitcoin purchases, and improving on-chain data supported the market’s recovery after the February and March selloff.
- Bitcoin’s April rebound reflected a structural recovery phase rather than a leverage-driven short squeeze.
That figure understates what actually happened beneath the surface. The recovery was architectural: higher lows replaced lower lows, positive cumulative volume delta (CVD) persisted across all major exchanges simultaneously for the first time since July 2025, and genuine altcoin rotation began to materialize. This was not a short squeeze. It was a climb built on institutional conviction and improving market structure.
Macro and geopolitics: the Strait of Hormuz as the central risk Toggle
Every meaningful price move in April traced back to a single 33-kilometer waterway. The U.S.–Iran conflict and its grip on the Strait of Hormuz functioned as the dominant on/off switch for global risk appetite, with Bitcoin (BTC) responding in near real-time to each development.
The month opened in a standoff. Iran had submitted a ten-point counteroffer to U.S. proposals, and Trump threatened to destroy Iranian oil infrastructure if no deal materialized.
On April 7th, just ahead of a self-imposed deadline, a two-week ceasefire was struck. Markets surged immediately, Bitcoin broke $73,000, and ETF inflows hit a single-day record of $470 million, the highest in roughly six weeks. The relief was short-lived.
The Strait closed again following the Lebanon attacks, and the first formal U.S.–Iran negotiation on April 12th collapsed with both sides unmoved. A second ceasefire extension arrived in the third week, buying time without resolution. By month-end, Iran had proposed a three-phase negotiation framework and collected its first Hormuz passage fee, symbolically denominated in Bitcoin, though settled in stablecoins.
The more important market insight was behavioral: by late April, ceasefire extensions produced progressively smaller price reactions. The market had priced in managed, unresolved tension as the new baseline rather than treating each extension as a fresh catalyst.
On the monetary policy front, conditions remained unfavorable. March CPI printed above 3%, non-farm payrolls came in at a robust 178,000, and CME FedWatch probabilities for any 2026 rate cut collapsed entirely, with the first cut now priced for September 2027. That Bitcoin gained over 11% against this macro backdrop is a statement about the structural demand operating beneath the surface.
Bitcoin price action and on-chain structure
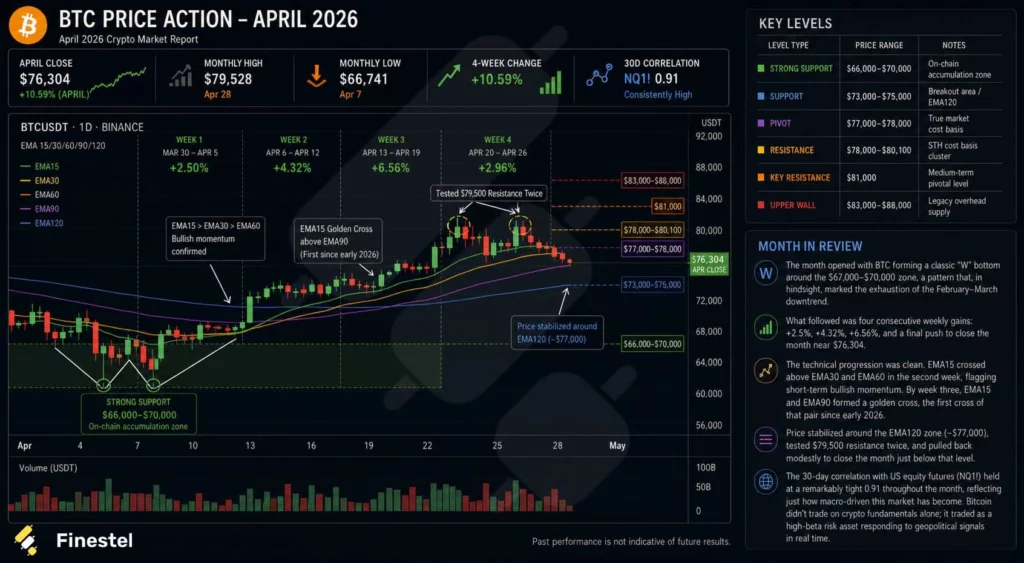
Bitcoin’s April trajectory followed a textbook accumulation pattern. The month opened with a classic “W” bottom forming in the $67,000–$70,000 zone, marking the exhaustion of the February–March downtrend. What followed was four consecutive weeks of gains, +2.5%, +4.32%, +6.56%, and a final push to close near $76,300.
Bitcoin price action – April 2026. Source: Finestel.
The technical progression was orderly. EMA15 crossed above EMA30 and EMA60 in the second week, confirming short-term bullish momentum. By week three, EMA15 and EMA90 formed a golden cross, the first such signal since early 2026. Key resistance remained clustered between $78,000 and $80,100, representing short-term holder cost basis, and Bitcoin tested $79,500 twice before pulling back modestly into the month-end.
On-chain data told a nuanced story. Early in the month, selling pressure was dominated by profit-taking and capitulation in the $65,000–$73,000 range. By late April, the character of selling had shifted; the primary sellers were holders from the $88,000 range exiting at mild losses, a fundamentally less aggressive dynamic.
New accumulation concentrated around the $77,000–$78,000 zone, and the URPD structure showed the gap between $74,000 and $80,000 filling progressively. Long-term holders showed early stabilization: no longer distributing, but not yet accumulating aggressively either.
Institutional capital: the engine behind the recovery
April’s recovery was not retail-driven. The structural bid came from institutions, with one company making history in the process.
Bitcoin ETFs posted three consecutive weeks of significant net inflows: $786 million, $996 million, and $823 million, respectively, with a nine-consecutive-day inflow streak representing the longest such run of the year. Strategy executed the third-largest single-week Bitcoin purchase in its corporate history, 34,164 BTC at an average price of $74,395, totaling $2.54 billion, bringing its total holdings to 815,061 BTC.
The company simultaneously proposed accelerating its financing structure, moving STRC’s preferred stock dividend payments to a bi-weekly frequency to enable faster capital deployment into Bitcoin.
The institutional landscape broadened further. Goldman Sachs announced plans for a Bitcoin Premium Income ETF. Morgan Stanley advanced a Bitcoin Spot ETF toward NYSE listing. Schwab announced spot cryptocurrency trading services. BlackRock’s IBIT options open interest surpassed Deribit, a landmark in the institutionalization of Bitcoin derivatives markets.
One critical nuance: U.S. and non-U.S. institutional flows diverged sharply. Non-U.S. markets, primarily Binance, led the early recovery in buying pressure. The Coinbase premium index remained negative for roughly 20 consecutive days before recovering, indicating that American institutional capital lagged noticeably.
This asymmetry explains why the recovery, though real, lacked the explosive velocity that full U.S. re-engagement typically produces. The return of domestic institutional demand remains the primary upside catalyst heading into May.
Market structure, sentiment, and the altcoin landscape
Global spot CVD remained positive throughout April, confirming that dip-buying was the dominant market behavior.
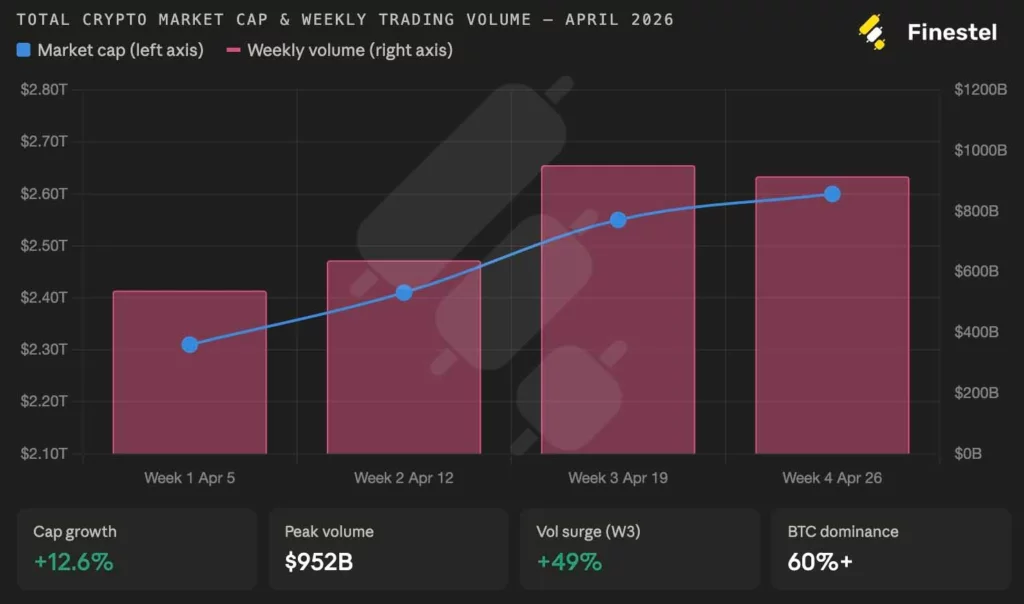
Total crypto market capitalization expanded from $2.31 trillion to $2.60 trillion, a 12.5% gain.
Weekly trading volume peaked in the April 13–19 window with a 49% surge.
Bitcoin dominance crossed 60% by month-end, a characteristic pattern of early recovery phases where capital anchors in liquidity before rotating outward.
Total crypto market cap. Source: Finestel.
That rotation began materializing in April’s final week, with select altcoins showing genuine fundamental catalysts rather than pure speculation. Among the notable movers: EDGE (edgeX) gained 62.1% on real DEX revenue and a token buyback program. ZEC (Zcash) rose 42.8% following a Grayscale ETF filing and a meaningful jump in privacy pool utilization.
ARIA gained 51.7% on whale accumulation and AI gaming sector momentum. Alongside these were the inevitable meme-driven anomalies; RAVE’s 3,599% move stood as the clearest example of social-media-amplified artificial squeezes rather than durable value creation.
How professional asset managers navigated April: discipline over FOMO
Finestel’s AUM-weighted data across tracked professional asset managers revealed perhaps the most instructive lesson of the month: the managers who performed best were not those who predicted the rally, but those who had done their risk management work in February and March and entered April prepared for it.
| Allocation Category | March 2026 | April 2026 | Change | Commentary |
| BTC/ETH Core | 53.5% | 54.5% | +1.0% | Increased on dips; viewed as the highest-conviction anchor amid improving structure |
| Stablecoins | 28.0% | 23.0% | -5.0% | Selective deployment into strength; reduced dry powder as confidence returned |
| Yield-bearing DeFi / RWA | 13.0% | 13.5% | +0.5% | Slight increase for consistent yield in still range-bound environment |
| High-Conviction Alts | 5.5% | 9.0% | +3.5% | Targeted rotation into AI infrastructure, privacy, and select L1/L2 plays |
The tactical playbook these managers executed was consistent and repeatable. They defended or modestly added to BTC/ETH core positions during dips rather than trimming into weakness.
They kept leverage low and used options to hedge around the high-uncertainty events that defined April’s calendar: the CPI print, the failed April 12th negotiations, and the ceasefire extension announcements.
They rotated into altcoins incrementally, not aggressively, and only into names with identifiable catalysts rather than pure sentiment plays. And critically, they did not chase.
When Bitcoin surged past $73,000 on ceasefire day, the best-performing managers were already positioned; they had bought the $67,000–$70,000 zone during the fear, not the relief.
The underlying philosophy was one of asymmetric preparation: accept some upside drag during uncertainty in exchange for the ability to act decisively when opportunity presents itself. In a month defined by whipsawing geopolitical headlines and macro surprises, that philosophy paid off meaningfully.
Risk appetite increased across the board by month-end, but it increased in a controlled, structured way, exactly the kind of risk-taking that compounds over time rather than the kind that gives it all back on the next drawdown.
The outlook: structural progress without structural confirmation
May begins with Bitcoin better positioned than at any point since late 2025, but “better” is not the same as “clear.” The bull case requires a decisive close above $81,000 on strong volume, which would open the path toward the $83,000–$88,000 overhead supply zone.
The ingredients exist: ETF inflows are consistent, leverage has reset, and a full U.S.–Iran resolution would eliminate the dominant macro tail risk in a single headline. The bear case is simpler, failure to hold $73,000–$75,000 on any meaningful selling pressure, particularly given the dense short-term holder cost basis overhead.
The honest read: this is a high-quality recovery that requires confirmation, not a trending bull market.
Three questions will determine May’s direction: whether Bitcoin can sustain above $77,000, whether U.S. institutional capital re-engages in force, and whether the geopolitical situation evolves toward resolution or calcifies into a permanent tax on risk appetite.
April rewarded preparation. May will reward patience combined with readiness.
Disclosure: This article does not represent investment advice. The content and materials featured on this page are for educational purposes only.